My career has been what you might call “nontraditional.”
Very few Wall Street analysts spent their early 20s doing theater in Greenwich Village.
When I started teaching myself about investing – just because I was a struggling actor didn’t mean I had to be a starving actor – I learned how to read financial statements and analyze companies (fundamental analysis). Then, when I started trading, I studied price action (technical analysis).
After a few months at my job as a fundamental analyst with the most contrarian research firm on Wall Street, I was approached by my boss, who’d heard I knew about technical analysis. Imagine my surprise when he asked me to start writing a technical analysis note for clients every morning.
Since then, I’ve always used technical analysis as a timing tool when looking at a stock or sector.
Today, I’m shining my technical analysis light on the biotech sector.
The biotech sector can be volatile. Biotech stocks can have big swings depending on earnings, clinical trial data or regulatory approvals.
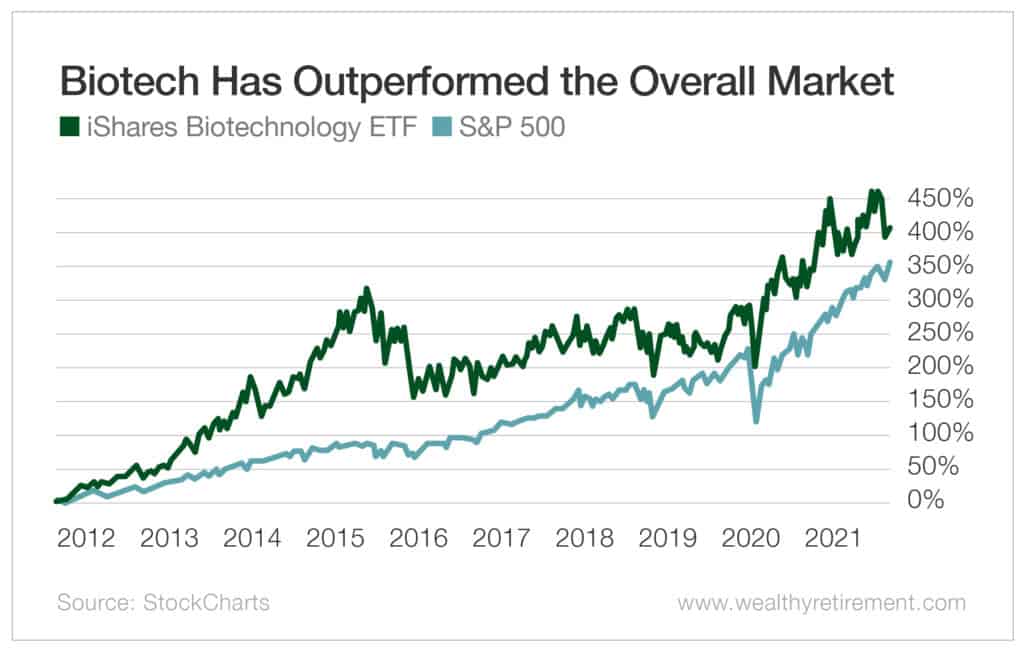
Over the past 10 years, the sector has outperformed the overall market. The sector, as represented by the iShares Biotechnology ETF (Nasdaq: IBB), is up 407% while the S&P 500 has gained 352%.
[Hot New Tech: This odd-looking machine could be the most transformative innovation in history]
Recently, however, the sector hasn’t been great. Since hitting a high of $177.37 in August, the biotech exchange-traded fund (ETF) is down 11%. Meanwhile, the S&P 500 is up 2.5% over the same period.
Despite the recent drop in the biotech sector, I like its technical setup.
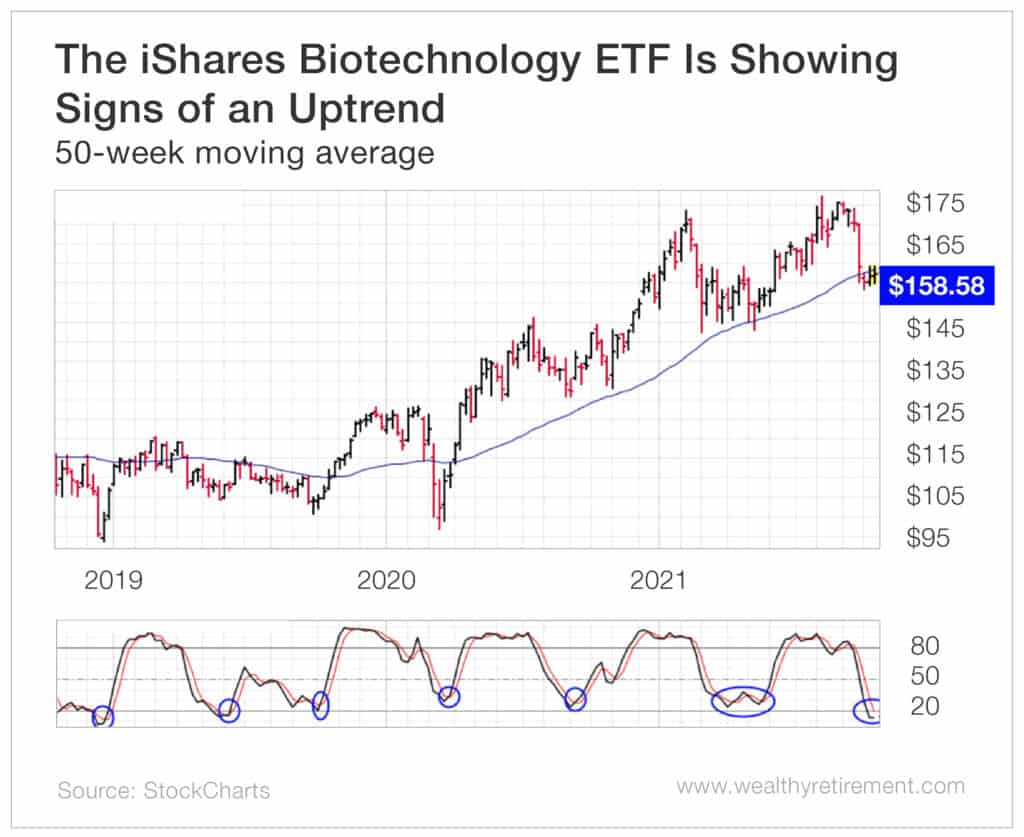
Shown below is a weekly chart going back three years. It shows the performance of the ETF up close.
You can see that the iShares Biotechnology ETF has made higher highs and higher lows, an important feature of an uptrend.
Furthermore, the reading on the bottom of the chart is a technical indicator called a stochastic oscillator. It is a measure of momentum. Whenever stochastics hit 20 (like the instances circled in blue on the chart), the stock is considered oversold. You can see that over the past three years, practically every time stochastics neared 20, the ETF rallied.
[Discover: The off the radar Small-Cap Stock at the center of an Era-Defining Technology]
Today, stochastics are very oversold and starting to turn higher, which suggests a move higher is imminent.
Lastly, the 50-week moving average is at $158.58. The moving average has acted as support and resistance in the past.
As a refresher…
Support: An area where a stock stops moving lower.
Resistance: An area where a stock stops moving higher.
When a security crosses its moving average to the upside, that is a very bullish sign.
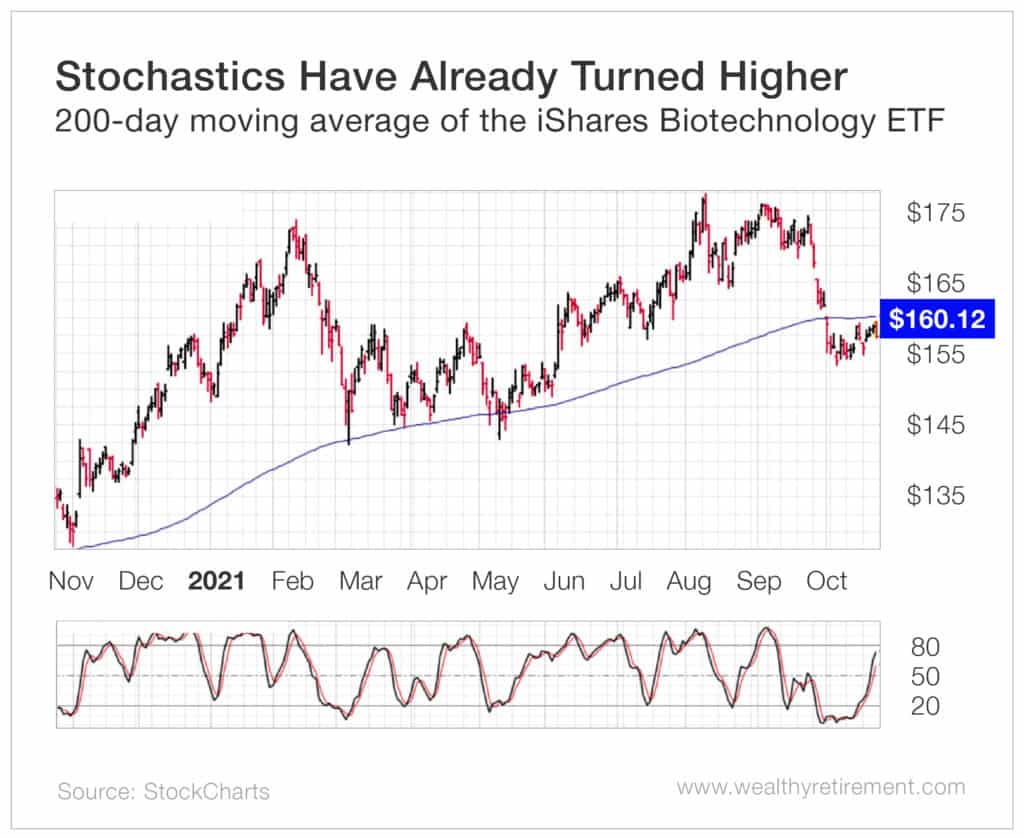
If we drill down to the one-year daily chart, shown below, you can see stochastics have already turned higher and the ETF is up against a 200-day moving average. Similar to the 50-week moving average, it acts as support and resistance.
[Breakthrough: Scientists Predict this Industry Could Grow Nearly 200,000% in Just Four Years]
Seeing as the two moving averages are close to the same price, if the iShares Biotechnology ETF trades at around $165, that is a break of two important areas of resistance (its two moving averages). That indicates the price will continue higher from there.
The top three holdings in the iShares Biotechnology ETF are Amgen (Nasdaq: AMGN), Moderna (Nasdaq: MRNA) and Gilead Sciences (Nasdaq: GILD). But once the ETF crosses over those two moving averages, it’s game on for the entire sector, not just the top stocks in the ETF.
Use your research skills to find great companies and stocks you want to invest in, and then use technical analysis to better time your buys and sells.
It’s not a traditional way of investing, as most investors use only one of those two methods. But when it comes to investing, I’ve never been very traditional.
[“Imperium” – The Next Intel: The Microchip Company Powering the 199,000% DNA Mega Trend]


